Apple (AAPL): the charts told me to do it
Our weekly ETF charting education focus


The SIRG Institutional model signal service is now available. You can learn more about it and follow our stock work and investment papers at www.SungardenInvestment.com
We welcome your questions about this and the rest of our investment publishing work!
How could anyone could have predicted that the beloved, iconic Apple Inc. (AAPL) would fall 15% in roughly 3 months? WRONG QUESTION! Allow me to explain.
Here’s a daily price chart of AAPL going back a few years, and as of just before today’s close. I circled where there was potential trouble brewing, but the big picture is that this stock topped out at around $200. Twice. That’s what they call a “double top,” and although it doesn’t always stop an ETF or stock from flying higher, it is an area where we technicians take a close look to see what happens. The “failure” to cross above $200 and stay there was the yellow flag, and the circled area is where the weakness started showing up in my more detailed indicators.

What’s next? I don’t know, I’m just an investment chartist! But I do know that this is still a high risk situation, and that AAPL is 6% of SPY, the second largest stock next to Microsoft (MSFT). Yet it is only 3% of DIA, the 16th largest Dow stock since that index is weighted by dollar price of the stock, not market capitalization. That has a lot to do with why on a day like today, when AAPL tumbles 4.1%, DIA holds up better than SPY.
FYI, as with many popular mega-cap stocks there are now ETFs that exist simply to short those stocks individually, either 1:1 or with leverage (2x or 3x). AAPD is the single inverse short version of AAPL. Yes, ETFs do nearly everything now! Just not as much as Artificial Intelligence is going to.
Pulling back up from the details and pictures, the more we see FAANG-type stocks like this one peel back from their all-time highs, yet the major averages keep going up, the more it looks like a broadening or more “democratic” opportunity for investors to use the stock market. How long this will last following the sharp rallies we’ve seen is what no one knows. However, it is at least encouraging that the stock market, for now, is giving us more ways to win that we’ve seen in a while.
New features in the premium research deck
As Chef Emeril Lagasse famously says, “let’s kick it up a notch!”
I’ve added an “at a glance” table with the 11 S&P 500 sector SPDR ETFs, and my quick comments on those which I think merit that.
I’ve added this to what was the MACRO DEPTH CHARTS tab, now renamed “WEEKLY CHART BITES” that already houses the 10 macro ETF table already there. And we’ve moved the “Tactical 5” there now so all of my short-term technical work is in one spot, updated Thursdays.
All tables are now updated, so check the shared research deck.
As a reminder, these are my chart evaluations for shorter-term views, looking at potential over the next 1-3 months or so.

I’d like to offer you a discount on Seeking Alpha Premium, a service I use and contribute to daily. If you want to check out the service you can save 20%for the first year!
PREMIUM SUBSCRIBER SECTION
Breaking News: Rob can’t add!
Oops. In this past Tuesday’s (March 12) premium commentary I wrote:
I’ll be making the following moves here:
NEW BUY 10% AIA
REDUCE DIA from 30% to 20%
It is updated in the research deck, but here’s what the model looks like once these changes are made tomorrow AM

Well, as one astute subscriber pointed out to me shortly afterward, when you add 1 ETF to a 7 ETF model and reduce the weighting of an existing holding…that makes it an 8-ETF model! My bad, but easily correctable, as I’ve done in the sheet and as shown here:
CORRECTED 7-ETF MODEL
Trades:
NEW BUY 10% AIA
REDUCE DIA from 30% to 20%
SELL ALL 10% BIL
ADD 10% to SHV (goes from 20% to 30%)
BIL (1-3 month T-bills) and SHV (3-12 month T-bills) are so similar, just consolidating them to 1 position makes it easy to maintain the 7-ETF structure. Here’s the corrected model portfolio:

I’ve got to get better at math :-)
Macro depth chart: ranked list of 10 ETFs representing broad stock/bond segments

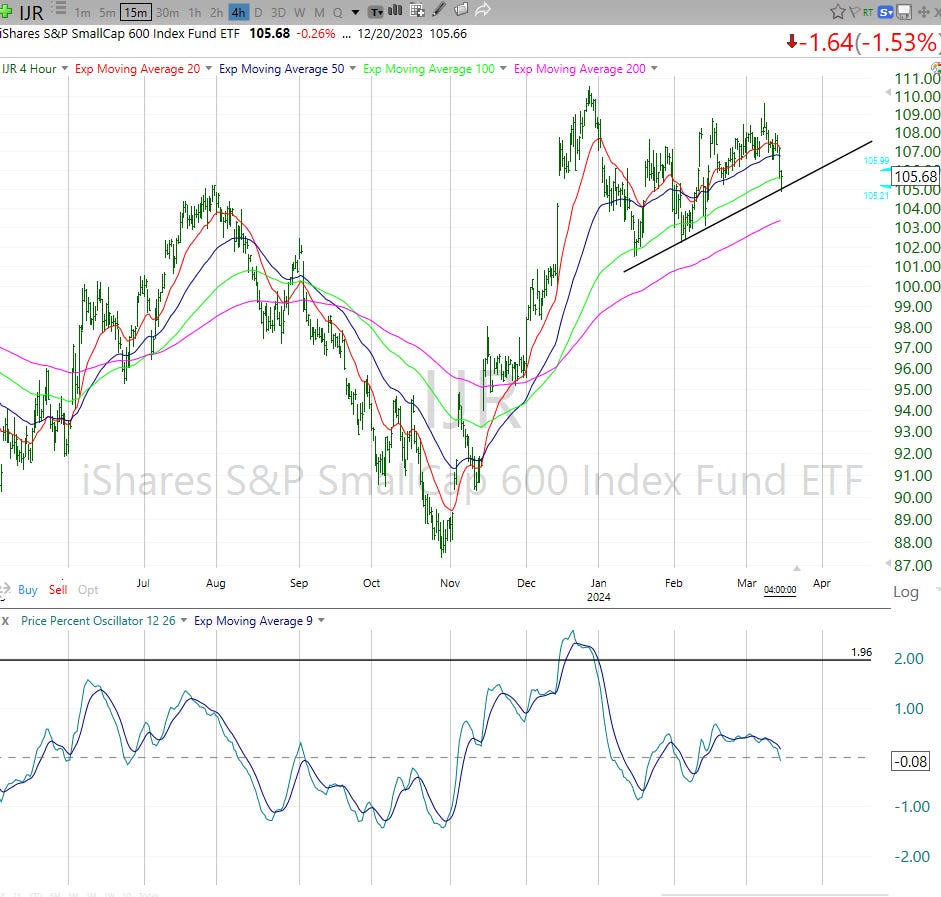
I’m getting more comfortable about being so stubborn when it comes to this list. Because based on today’s understandable mini market freak out over a slide in retail sales, a tick higher in producer inflation and the renewed estimate of the first Fed rate hike coming in July, not June or March as many thought earlier this year, T-bills remain the top asset in this macro-markets chart. IJR, pictured below, is knocking on the door of trouble, shown by that short-term trend line right where it closed today, while the PPO indicator (bottom section of chart) just crossed into negative momentum territory. IWM the other main small cap index, looks slightly worse. That’s what happens when investors are reminded that if rates don’t spike down as they spiked up, and do it soon, 40% of the Russell 2000 index has a big problem. They are not profitable companies, and debt is coming due.
“Tactical 5”: 5 ETFs from our watchlist I find most interesting right now (for different reasons, as explained in note form)
AMLP: strong recent run in danger of rolling over
GDXJ: I just wrote about this on Seeking Alpha. Looks as tired as my kids did 20 years ago at the end of a day at Disney World…very tired.
GOVI: lower lows, lower highs implies increased inflation threat and rates.
PBW: clean energy ETF looks very dirty to me. Sinking ship.
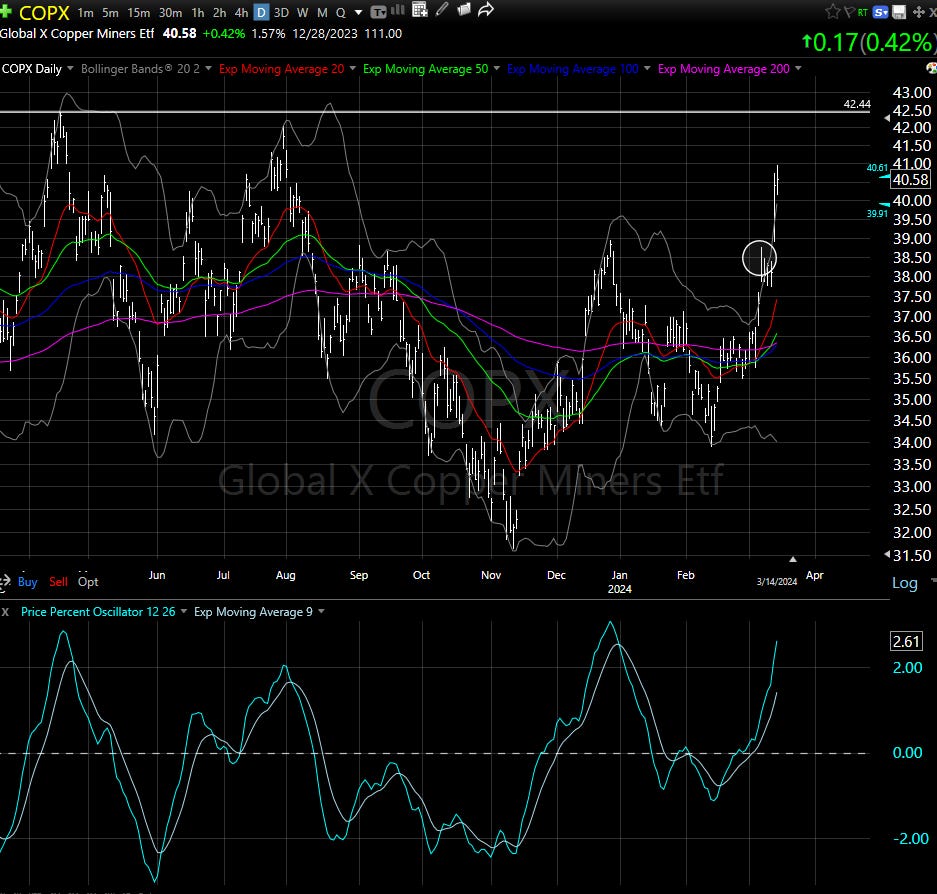
COPX: last week I wrote in this space “Doctor Copper” has a prescription. Not more cowbell. Possible breakout toward highs from…wait for it…2012! Let’s see if it follows through. I circled below where it was then and now it is up more than 6% in a week’s time. I am NOT bragging about that. Rather, I am showing what I’ve been writing about and what I spoke about at last night’s live Zoom session: this has been a market where, outside of Mag-7 stocks, a lot of the moves happen so suddenly, they are gone before I can get a lot out of them. So here’s COPX, now just 5% from its multi-year high, but half the move from last week to that high around $42.50 is already done.
This is why one of the 7 “portfolio buckets” that makes up our new institutional service is a small “swing trading” bucket. Because not all of these will continue to run away, and also I’m OK with allocating some of my money (10% or less) to taking some shots like this, in anticipation of these types of moves.