December 26, 2023
The latest research, market indicators and trade summaries from Sungarden Investment Publishing
ROAR Score
(Return Opportunity and Risk)
If my choices are stocks and cash, what % would I have in the stock market right now?
ASK ME ANYTHING: an ETFYourself live event
Tuesday, January 9, 2024 at 5:00pm ET
Agenda:
Rob walks you through the latest newsletter and market views, live!
Introduction of several new features to the ETFYourself.com site
Your questions…about anything…answered
Registration Link HERE
Market in a Minute
It is a short week, the last of 2023, and any market activity will be somewhat discounted by the expected lack of trading volume that typically occurs. So, we’ll keep it short but impactful this week.
If you combine last week’s Tuesday and Thursday posts (12/19 and 12/21), you read about a few possible early-2024 market scenarios, and the fact that the several major market benchmarks are sitting around critical technical levels, showing no signs of making up their minds. Nothing since last week has changed that.
What also hasn’t changed: the shortest-term T-bills are STILL yielding a lot! Of all of the things that happened during this year that is about to close, this might be the most remarkable to me. Because when risk-management is your priority, and the closet thing to riskless an investor can get is being “given away” for what amounts to 2/3 of the annual long-term return of the stock market, it means something.
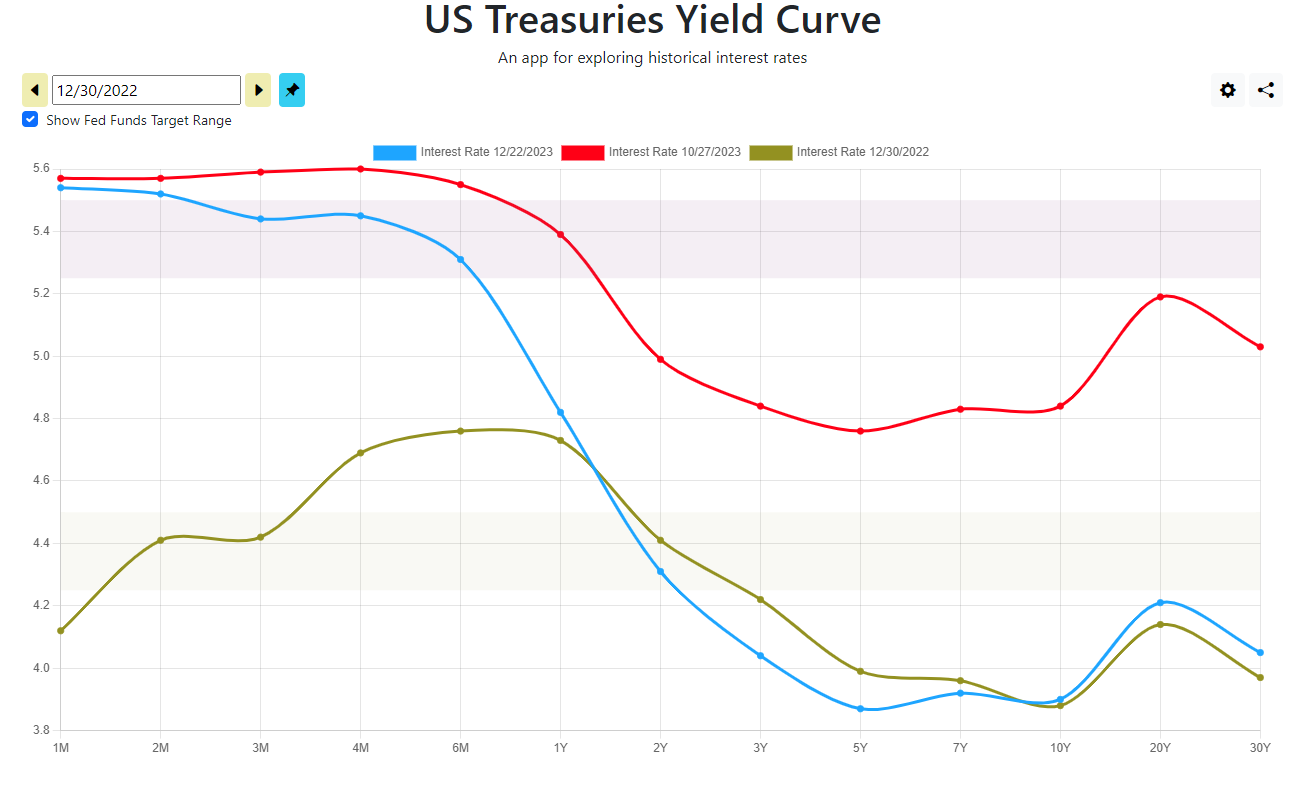
In the chart below, the green line is the US Treasury yield curve about 12 months ago, the red is where it was on 10/27 of this year when the stock market and rates bottomed, and the blue is as of last Friday. Below the chart, I explain what I think it means and why it matters.
The long end of the curve is only slightly above where it started this year. That’s what the biggest bond price rally in 40 years will do. We recently had that occur.
The 2-5 year part of the curve, where many investors tend to focus on when they buy individual bonds since they don’t want to lock their money up for decades, is actually lower in yield than a year ago. In the case of the entire curve, rates have taken an absolute swan dive in just the past 2 months…
…except for T-bills! Yes, they have dipped in yield a little bit. But they still yield 5% or higher all the way out to this August. Why do I sound so excited? Because at times like this, being able to secure an annualized rate of 5.3%-5.5% for up to 6 months translates to be being paid well to wait.
Wait for what? For the stock or bond markets to “clear.” There is still too much speculative fervor, too much Fed-obsession and too much volatility in places it shouldn’t be (I’m looking at you, interest rates!).
And while I don’t intend to just throw it all into T-bills, given the tactical/trading/shorter-term setups I see in several areas, those 2 strategies (T-bills and tactical management) give me another quarter or so to get a clearer picture. That doesn’t happen very often. As in, not since December of 2000.
The plan:
Our ROAR Score stays at 35, where it moved up to two weeks ago from 25, after 5 straight weeks at that lower level. Our 2-ETF model portfolio is 35% in SPY (S&P 500) and 65% in BIL (1-3 month T-bills).
For those who may be curious, the ROAR Score’s weekly average for 2023 was 22. It was between 40 and 0 during the year.
With just a few days left in the year, the 2-ETF model that strictly follows the ROAR Score is up about 6.6% in 2023. Importantly, its standard deviation was a mere 2.6%, which is 1/5 of the S&P 500 (SPY) and 2/5 of the US Aggregate Bond Index (AGG).
ETFYourself.com is new, but the investment process behind it has evolved over the past 3 decades. You bring the desire, we'll provide the tools!


