


ETFyourself.com: Sunday Edition (5/5/24)
Chart of the week, performance updates and more

A Key Chart I’m Watching This Week
Your best case and your worst case
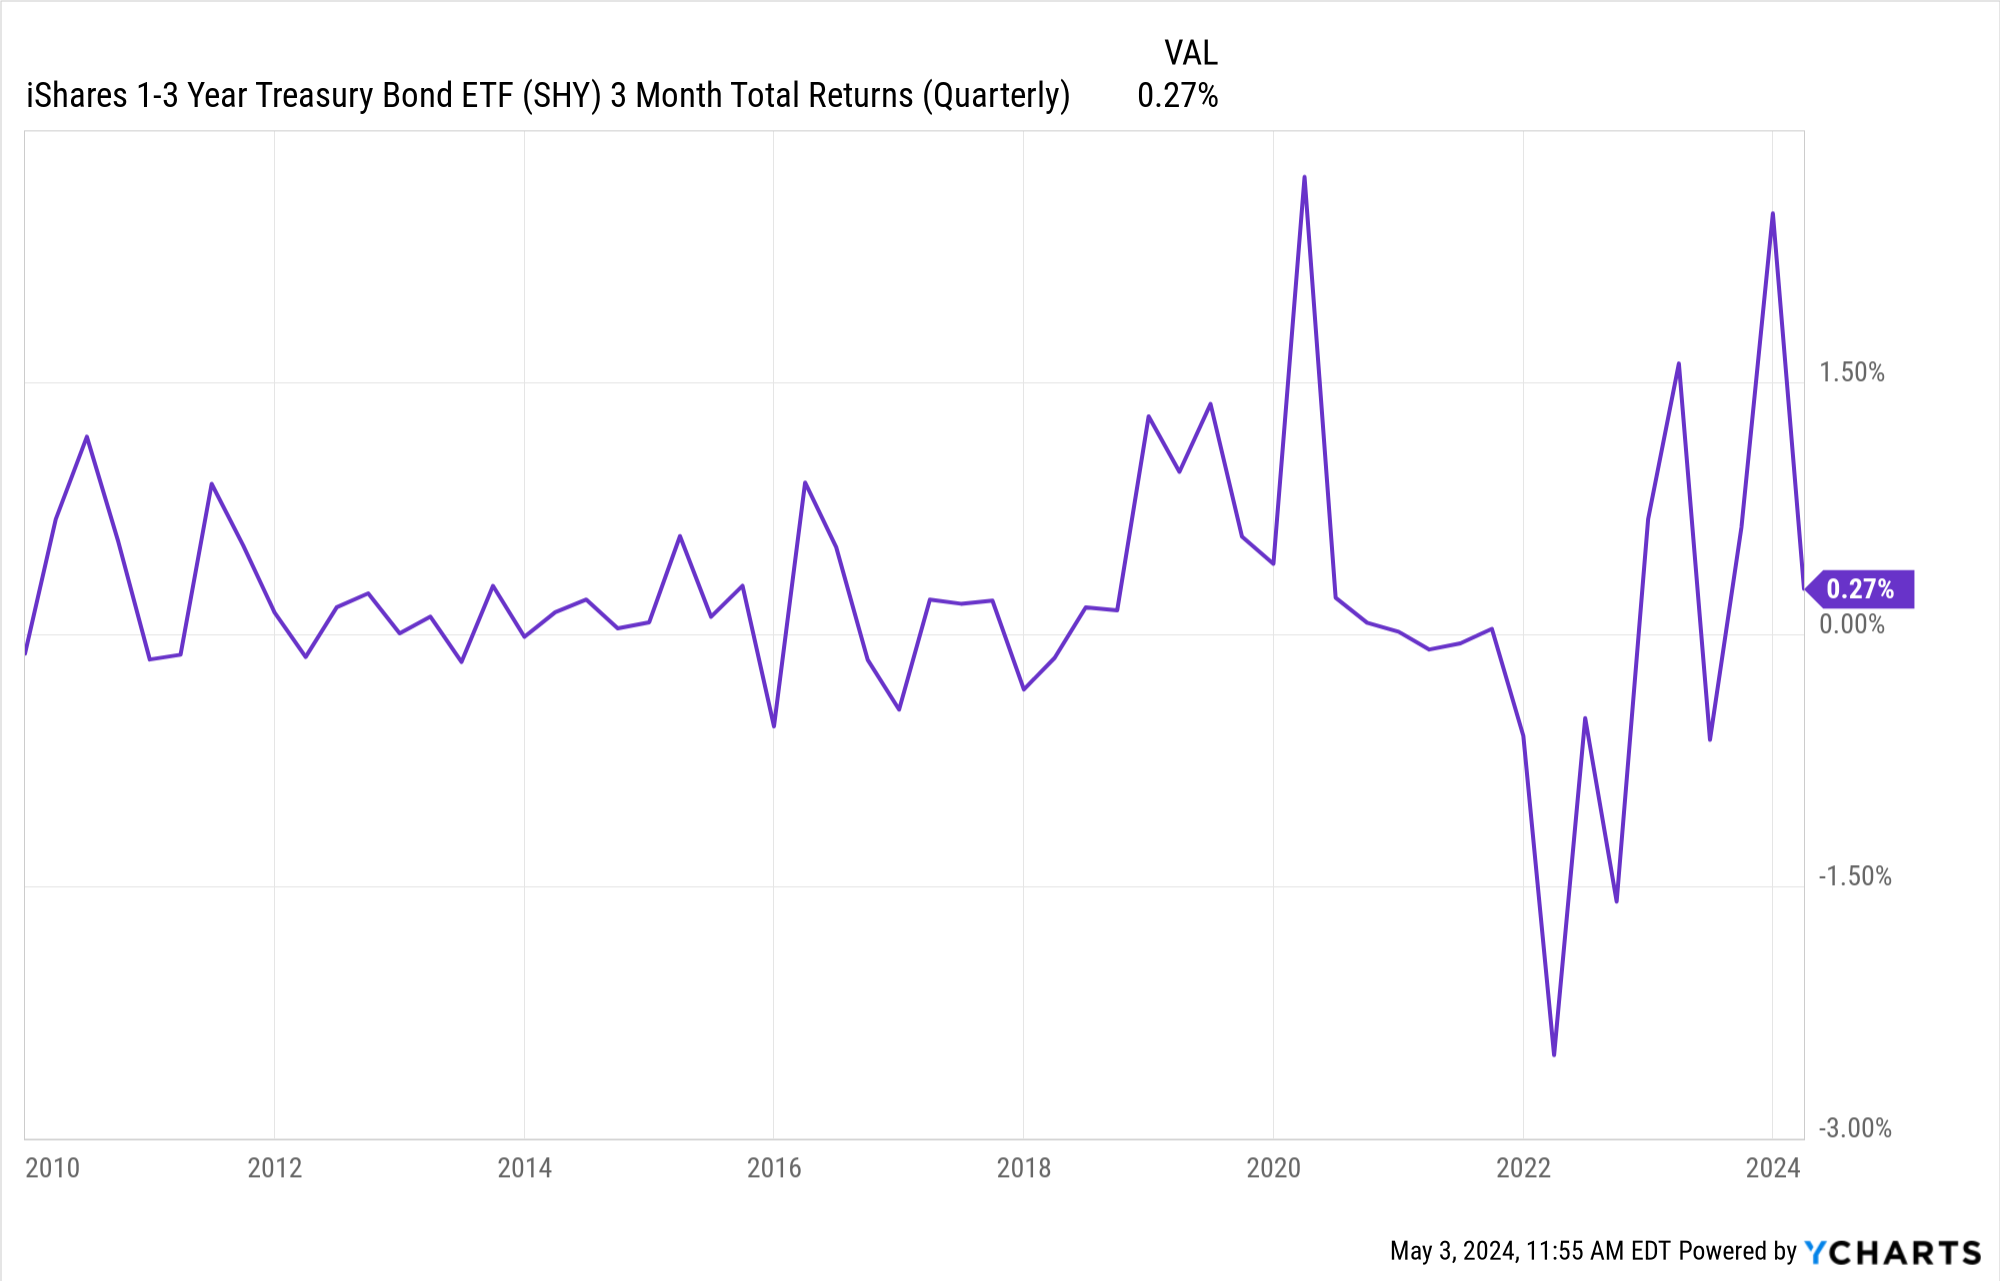
As I’ve written and said enough time to be borderline obnoxious, T-bills have been the gift that keeps on giving. High rates on short-term US Treasuries stink for consumers who are debt-heavy and asset-light, but they are great if you have accumulated some wealth.
The 2-year US Treasury Note is at 4.8%, off a bit from a recent high around 5%. This chart above shows that for years, the total return on an ETF that invested just beyond T-bills, out to 1-3 year Treasury Notes, provided nothing. But in recent years, there’s been some “meat on that bone,” so to speak. When the Fed jacked up rates 11 times, all I could do was watch to see where it might end. That’s still not known, but there is some ebb and flow to this part of the bond market now, and while what I see may not be of interest to many, perhaps it helps some investors.
What I see: ETFs like SHY typically don’t provide anything beyond the yield (which as noted is great right now). But occasionally, when rates of this maturity length spike up, then show signs of retreating, that creates at least an interim opportunity to earn a total return beyond that 4.8% yield, via price appreciation. The key is that the bonds involved are short term, so if it doesn’t “work” the cost is quite low.
As with anything, I look at this and conclude reward/risk tradeoff. And while I’m not quite there yet, I am looking this week at whether there might be what we saw a few times in the past. A chance to maybe up that annualized total return on ETFs like this to perhaps 6-8% over the next few months.
And, if the Fed grants the market’s wishes and lower rates sooner than it probably should, that could compound this effect, and that “total return” beyond the 4.8% yield could extend a while, perhaps well into next year. Just a thought, but one that I’ve profited from before. I’d rather try to earn extra “yield” this way than “reaching for yield” the way I read about others doing, by owning lower-quality bonds with real blowup risk.
I welcome your thoughts on this!


Performance That Matters
(data through Thursday close)
Here’s the usual weekly table of ETFs that represent several major asset classes and objectives. In yellow on the right, I’ve sorted them by ascending order of “max drawdown” since the start of the pandemic. That’s essentially the worst-case scenario if you bought at the high and sold at the low.

The takeaway: be careful labeling yourself as an investor
For example:
“I’m conservative” - good, so you’re OK seeing every $100,000 you have invested drop to $81,000, not knowing for sure when and if it will recover?
“I just collect dividends, I don’t worry about the stock prices” - and that’s still the case when, as has occurred multiple times this century, every $100,000 you have invested drops to $54,000, and that includes the dividends received?
LET US KNOW WHAT YOU THINK (via the chat or email to info@etfyourself.com)
Rob Isbitts on etf.com
You can see my full history of articles for etf.com on my author page here.
Our favorite podcasts
Visit our Learning Center tab at ETFYourself.com, where we have links to our favorite podcasts. We’ll keep building the list as we find and like them!
People don't know what they want until you show it to them - Steve Jobs
The Sungarden Institutional model signal portfolio
Who is this for?
High net worth, self-directed investors looking for more help, less hype
Investment advisors seeking a research engine and efficient access to an OCIO
Institutional investors who want a true “alternative” to mainstream approaches