February 27, 2024
The latest research, market indicators and trade summaries from Sungarden Investment Publishing
ROAR Score
(Return Opportunity and Risk)
If my choices are stocks and cash, what % would I have in the stock market right now?
Catch my latest interview with Seeking Alpha’s Rena Sherbill by clicking this LINK
Title is “Don't Rely On Past Performance”
Market in a Minute
Beware the rides of March!
According to this source, the Ides of March falls on March 15 and is associated with misfortune and doom. It became renowned as the date on which Roman Dictator Julius Caesar was assassinated in 44 BCE and was further immortalized in Shakespeare’s tragedy named for the fallen leader. Since I am an investment wonk who knows more about dining on Caesar salad than explaining classic literature, I’ll leave that right there, and move on to the “rides of March.” Because here we are, about to enter the third month of 2024.
And while past performance is not reliable when viewed in snapshot format. That’s the point of my latest Seeking Alpha interview (link above). But market history, which I define as being a collective set of past events from which to draw conclusions about our “odds” as investors, is something we CAN learn from.
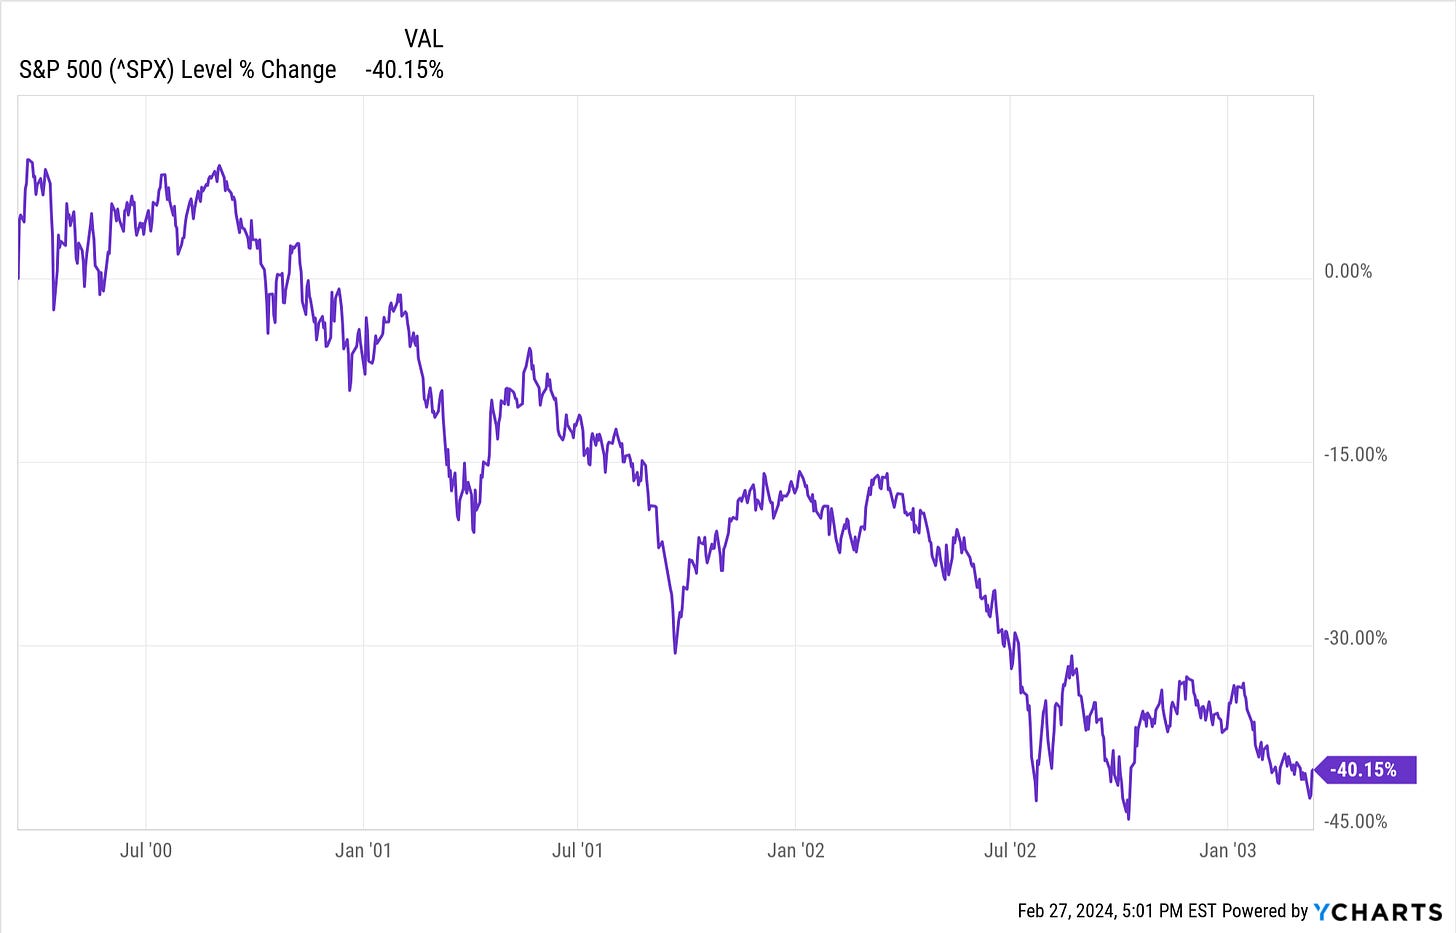
Stock market history has brought many roller coaster rides that began in March. Like this one from the Ides of March 2000, which didn’t stop falling until around the same time three years later. A dollar invested in the S&P 500 index become 60 cents over that time.
Does today’s market climate remind me of that time? If you have been following our work at ETFYourself.com, you know it does, quite a bit. But that was then and this is now, so all we can do is account for the possibility that the market is capable of doing that which you see above.
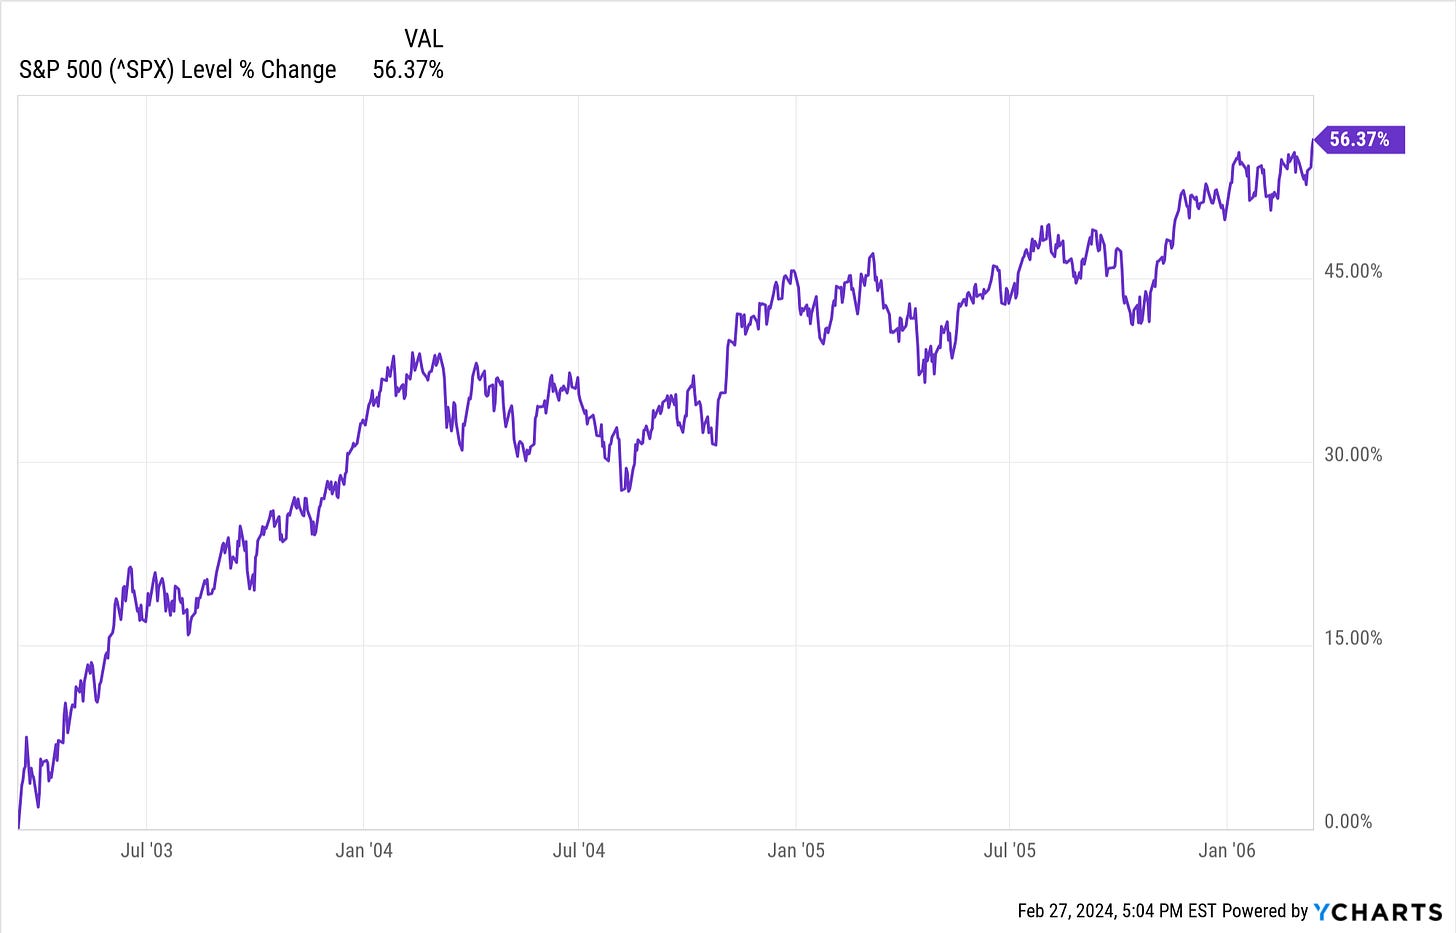
Likewise, here’s what happened from the Ides of March 2003 through 2006, the period immediately following that previous picture. Not bad at all.
And now, what may seem like a non sequitur.
This is not the S&P 500, and it portrays the relationship of 2 very different investment strategies from the start of 2015 through September 30, 2022, so nearly 8 years. The purple and orange lines ended up in the same place, but that’s like saying I flew from Fort Lauderdale to Newark, New Jersey, non-stop, versus a 4-legged flight that took 26 hours. Same destination, different paths entirely.
Yet it is almost a coincidence how these 2 asset mixes got here. Let’s explore so you can see my point of doing this:
AOR (purple line) is an ETF that invests in a classic “60/40” portfolio mix of stocks/bonds. It took the more volatile route, and at least in my eyes, even having 60% “static” exposure to stocks over the entire period caused more anxiety than many investors (including me) can handle.
The other mix (orange line) is one I created myself, using the SPY for 30% and allocating the other 70% to SHV, which owns only T-bills.
What’s the point(s)?
This is one of many reasons I despise “static” asset allocation strategies that assume stocks will always come through. I see the stock market as just a tool to get what I want out of my hard-earned investment capital. I don’t try to fall in love with the classic, flawed approaches to using equities I see elsewhere.
This is exactly why the ROAR Score is so dear to me, and why I couldn’t wait to have an opportunity to share it with an audience. It aims to educate investors on the potential advantages of viewing “asset allocation” as a sliding scale, rather than a static concept invented by folks who want to make sure they get their fees year after year on stock investments, which not coincidentally pay advisors and money managers more than allocations to bonds and cash equivalents. If bonds paid more to them, rest assured the catch phrase would be 40/60 and not 60/40!
Granted that it is hindsight, but this shows that for a while now, taking half the risk (equity exposure 30% versus 60%) earned about the same over this period. And, this was primarily when interest rates were near zero, so the SHV (70%) portion of the orange line portfolio essentially contributed nothing.
The #1 reason I believe I survived as a professional investor of “other people’s money” from the mid-1990s through 2020, and that my work still finds an audience (thank you!) is this: investing is surrounded by risk, the ones that end up striking investors, and the ones that don’t but were still a threat.
By accounting for multiple scenarios, truly understanding what is reality versus mythology in investing, and having a rock-solid foundation (for me it is the charting work I do), the probability of generating strong outcomes, but at least as well as I need to, is very good.
S&P X-Ray
The S&P X-Ray tracks our latest projected trading ranges
for the S&P 500
(Updated weekly on Tuesday, as of Monday’s market close)
I am repeating myself again, and hopefully no one in our audience will think I’m confused. I am just continuing a “current topic of interest” to me. Here’s what I wrote earlier this month:
Show me a breakout with force above that (5,000) level, with more than just a small number of stocks carrying things…
The first part happened but the second part hasn’t.
Today, I finally moved up the “Top” levels for the S&P 500 over the next several (think 3-6) weeks and months. I moved the weeks from 5,000 to 5,500 and the months just slightly higher from 5,400 to 5,500. The bottom levels remain. So if we look at the weeks row, the upside is higher to the top, but instead of about a 4:1 downside/upside reward/risk estimate, it is now “only” 2:1.
The S&P 500 is up about 6.8% year to date through today’s close. But by my count, 60 of the top 100 largest stocks are behind that mark and about 1 in 3 stocks are down since 12/31/23. Call me old-fashioned, but I like my bull market breakouts to be more inclusive.
Heck, I am still making room for a “bubblicious” rise from here. I’m just not seeing a sustained rally beyond the behemoth stocks. It is just too darn narrow, and I see it when I scout for dividend stocks. It is like an entirely different planet!
That translates to a continued low ROAR Score but with some pockets of opportunity in sight, as detailed in the premium commentary below.
Subscriber feedback drives ALL of this, so keep the suggestions and ideas coming!


