


February 6, 2024
The latest research, market indicators and trade summaries from Sungarden Investment Publishing
ROAR Score

(Return Opportunity and Risk)
If my choices are stocks and cash, what % would I have in the stock market right now?

Market in a Minute

Take it to the limit
Dana and I took a weekend trip to another part of the US, which happened to coincide with the iconic band “The Eagles” being in town on what I think is their second or third “farewell tour.” They haven’t lost a step in decades. Don Henley is 76 years old and still sings like he’s 26. The late, great Glenn Frey is gone, but his son Deacon is a rising star and honored his father for the second straight tour by playing in his place. Same with Vince Gill, a country legend, who joined the tour again. OK, that’s the music review. Now, on to the markets, but with a decidedly Eagles theme.
The markets have been living “life in the fast lane” since October, 2022, and it has surely made many market strategists lose their mind, figuratively. With all the government and consumer debt piling up, tech valuations stretched beyond what seems possible for even those giant companies to grow into and a growing list of under the headlines data on employment and the economy in general, how does the market sit near all-time highs?
Here’s why: because most stocks have gone nowhere for 2 1/2 years. I’ve cited that before here, but it is worth repeating over and over. Frankly, the most optimistic thing I can say about US stocks is that so many have been flat for so long (net-net since 2-5 years ago), they are due to resume the long-term upward trend that the stock market tends to have. But “life in the fast lane” has been the theme song for a very selective section of the market, filled with dot-com era vibes. It has not extended to far south in the market cap spectrum, nor overseas. In my experience, that’s an incomplete market…in other words, not one to be trusted yet.
The bond market was a tailwind (2009-2021), then a vicious headwind (2022-2023), then a vicious tailwind (late 2023-early 2024), and now it looks more like a headwind again. Those shifting winds have me thinking 2 things:
T-bills/short-term Treasuries are the place to be in the bond market for now
The rest of the bond market now acts as volatile as stocks, so why bother?
The past 12 months tell us all we need to know about the climate for productive investing. That is, that things make sense and that decisions don’t have to be second-guessed because of what some Fed member said, or an economic number (like employment) whose headlines grab attention, but don’t often reflect key parts of the picture.
The chart below sums it up visually. Since this time last year, QQQ has soared 41%, SPY 21%. OK, that’s the end of the good news, essentially. And the start of the deception. Because the average of the S&P 500 stocks gained only about 4%, slightly under T-bills. And when we include the next 500 to analyze the top 1000? On average, they are down! I don’t know what the top story is here: 1000 stocks averaging zero in what some call a bull market or the fact that the average stock has trailed SPY by nearly 2% per month for 12 months.
And, small caps (the ETF with the healthier set of stocks as opposed to IWM), as well as the inverse S&P 500 (weightings reversed to the giant stocks count the least) are both in the red the past 12 months.
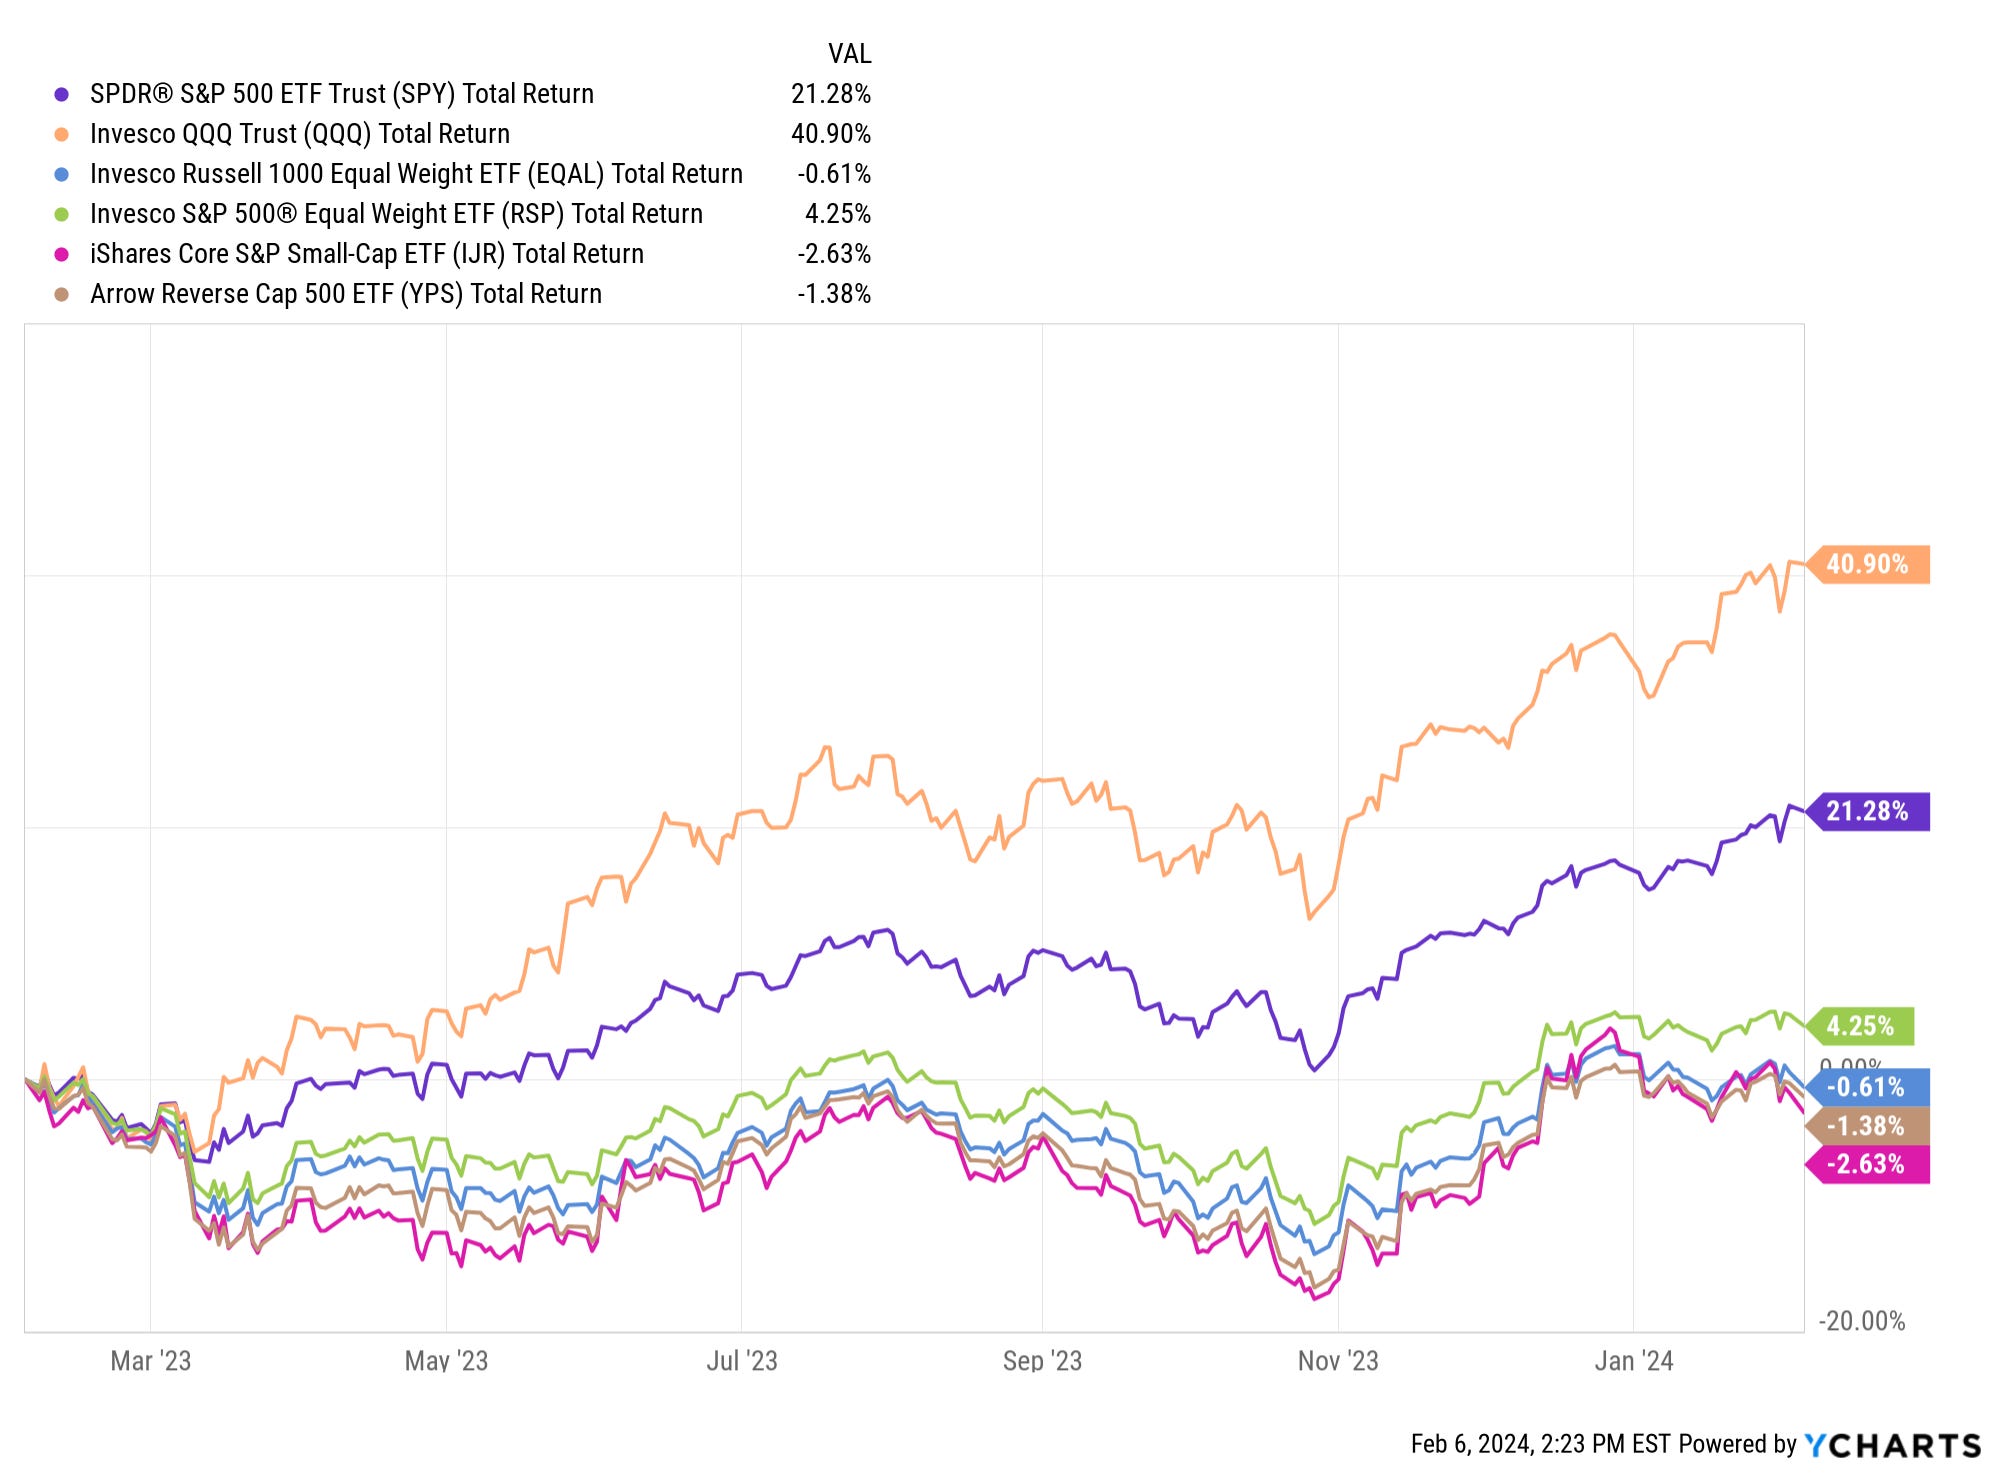
This is how we get an economy that some feel great about, but many are miserable about. Here, of the 80 points SPY added during the past 12 months, 50 came from these 8 stocks. Bull market, or “Lyin’ Eyes?”

OK, now for the big finish and the encore (yeah, more rock concert/Eagles song titles talk)
“I can’t tell you why”…the market is so messed up. That’s not our task. Ours is to figure out where to pursue return without blowup risk. That’s why I have 100 ETFs in my watchlist, covering scores of different types of return and risk potential.
“Wasted time”…not really. Investing is a process of consistently applying an approach and discipline, and being flexible at every turn. That’s how we can do this challenging task as fellow self-directed investors while maintaining a “peaceful easy feeling.”
“The long run”…is a series of short-run time frames of evaluating and monitoring risk. The ROAR Score we use and update each week aims to consolidate all of that brainwork and range of possible outcomes into a single number. This week, that number remains at 20, so our mighty 2-ETF portfolio remains at 20% SPY and 80% BIL.
Thanks for helping me avoid being a “Desperado” in this ongoing effort to do well by doing good. I’ve invested professionally for 30 years and nothing matches the feeling of being part of a “team sport” which is how I feel with all the questions and comments we receive from our subscribers. It picks up every week, and we are really moving toward the interactive community we sought when we started this gig about 5 months ago.
Thank you! And sorry, I couldn’t find a good way to fit “Hotel California” into this discussion. Oh wait, I just did.
S&P X-Ray

The S&P X-Ray tracks our latest projected trading ranges
for the S&P 500
(Updated weekly on Tuesday, as of Monday’s market close)

Additional note on the S&P 500 X-Ray this week:
You may be wondering why I have not adjusted the “weeks” outlook to above 5,000, with the S&P 500 just about 1% from reaching it. The answer: because I am a tough grader, and because I am certainly willing to “see” past that level, but the market’s sluggishness and still-stagnant technical outlook is not a moment to give the market any extra love, if you will. Show me a breakout with force above that level, with more than just a small number of stocks carrying things, and THEN we can look to the “months” trading range, where reward is higher…but so is risk.
More in this and our model portfolio updates in the premium section of this newsletter, below.
Subscriber feedback drives ALL of this, so keep the suggestions and ideas coming!