January 16, 2024
The latest research, market indicators and trade summaries from Sungarden Investment Publishing
ROAR Score

(Return Opportunity and Risk)
If my choices are stocks and cash, what % would I have in the stock market right now?

Upcoming Live Events
Wednesday 1/17
Rob talks YARP stocks at The Money Show Virtual Expo
I’ve been asked back by the Money Show to do another educational presentation. It is tomorrow, Wednesday 1/17 from 2:10-2:40 pm ET. I’ll be discussing YARP, the dividend stock analysis process I developed years ago, which allowed me to navigate some tough markets during my time as a mutual fund manager. That’s right, I’m an ETF geek and also a dividend stock geek! Join us if you can.
Sign up here for free
SAVE THE DATE: our first AMA “CHARTY PARTY!”
Given the tremendous interest in the charting part of what we do at ETFYourself.com, our next “Ask Me Anything” session will be 100% devoted to charting, learning and communicating what some call my investing “secret sauce.” I just hope the session doesn’t affect your body’s system like a Big Mac.
We’ll affectionately refer to this as the AMA “CHARTY PARTY.” Feel free to bring the beverage of your choice to this live video event.
Tuesday, January 23, 2024, 5pm ET. Link to sign up is here
Market in a Minute

How I “lost 100”: our new, slimmed down ETF list
Thanks to some excellent subscriber feedback, I spent lots of time during the past week doing something that should take the nice momentum we have as a community and, as the famous chef Emeril says, “kick it up a notch.”
Yeah, I lost 100…not pounds, but about 100 ETFs I dropped from the list of nearly 200 we started with for ETFYourself.com. That list is now at a trim and focused 100, and here’s why I am glad, relieved and excited that it is there.
First, investing is complicated enough without having information overload. Cutting down to the 100 ETF watchlist I will use going forward as a selection universe for our premium model portfolios and more in depth research helps you and me focus. We’ll henceforth refer to it as the “ETFYourself.com 100.”
I would not have done this if I thought the other 90+ ETFs I cut were the difference between pursuit of solid returns, value-added education and market-tracking. They are not. Blame the markets.
So much of investment research has been consolidated over the past few years. Maybe it is the pandemic roping in so many new investors. Or maybe it is technology, including the ETF industry itself, that has “index-ized” so much of what used to be a disparate group of stock-pickers.
Don’t get me wrong, stock picking is still a vital part of investing for many, including me. However, when it comes to ETFs, I reached the conclusion that there are a limited number of truly “alpha” return drivers and risk mitigators. The rest are just salespeople trying to sell you their product.
The ETFYourself 100: key features
A group of diverse ETFs that (still) includes a wide range of equity funds, from broad-based and factor ETFs to sectors, industries and themes. That is the crux of the “offense” side of the ball for us. The “defense” side of the list is smaller in number, and comprised of short-term US Treasury, other bond ETFs, inverse ETFs (that aim to profit from declines in certain market indexes) and a few “oddball” ETFs that I have found fill in some gaps to make my own portfolios prepared for just about anything the markets throw at us.
Importantly, many of the equity ETFs that made the cut have “concentration” in common. That is, they are weighed heavily toward perhaps 10-25 stocks. My use of ETFs has always been based on their ability to provide more diversification than a single stock, but not create “di-worse-i-fication,” a predicament where you think you are diversified but you really just own a big collection of stuff (ETFs) that you are impressed with…until you realize the paper tiger that approach is.
Markets are different today. They are “modern” in that they move more in sync than before, and often just at the wrong time…unless you are prepared with a toolbox that is big enough to create and rotate positions in the portfolio, but small enough to prevent “paralysis by analysis.”
So, the ETFYourself.com 100 is here. And it allows me to target and hyper-target the markets as much or little as I want. The 2-ETF model portfolio won’t change too much, since it is a simplified version of my “offense and defense at the same time” concept. But the 4-ETF and 7-ETF models, plus the weekly premium commentary on the most notable of those 100 ETFs should be more efficient for you, and even more focused for the research process I lead here.
So, that’s how I “lost 100.”
Now, about those markets
Check this out. What I’m showing is 10 years of returns for TLT (long term US Treasury bonds) and SPY (S&P 500 Index). As I often do, I am showing “rolling returns” over 6-month time frames. That allows us to see what all 6-month returns were for TLT and SPY.
I often analogize this to watching the whole movie instead of 10 seconds of it, which is what snapshot performance analysis (1 year, 3 years, 5 years etc.) is. The latter approach is great for people selling you based on past performance, but in my experience, that is one of the biggest reasons investors lose money in rough markets: they were uninformed, and Wall Street product producers and salespeople were not about to stop them from chasing those “sexy” past returns.

The chart above shows that over the past decade, TLT has become more volatile. The only 15% declines in 6 months have occurred in recent years (right 1/4 of the chart). This is not simply due to rising rates, but also because the bond market is getting “nutsy” like the stock market has been forever. SPY has been volatile as per usual.
But the bottom of the chart is the key. Admittedly, that last picture is a bit squeezed, but it shows increasing correlation in the returns of long-term bonds and stocks in recent years. A nearly 77% correlation is well above past norms.
Translation: the markets now speak with one voice and move in sync more frequently than in the past. What else would you expect when nearly all of the information advantages that investing pros used to have disappeared.
Information is easily available. That is great, except for the part where masses of people don’t understand what they are looking at, or worse yet, take arrogant stances with money they can’t afford to lose.
Market humble us all. But the slimmed down “toolbox” and regular communication and opinions from us, we hope that our subscribers can navigate modern markets with clarity and confidence.
Information is easy. Using it to crowd out the noise and hype, and make disciplined decisions is the vital part.
The plan:
Our ROAR Score drops to 20, ending its 5-week stay at 35. The SPY moved up about 3% over that time, and ROAR is now at its lowest level since early 11/14/23, when we moved it up from 10. Our 2-ETF model portfolio remains allocated 20% in SPY (S&P 500) and 80% in BIL (1-3 month T-bills).
If there were such a thing as a “forward-looking bias” to the ROAR Score (and maybe we’ll add one), I’d say it is negative. In other words, if asked whether I think ROAR’s next move is up or down, I lean down. The S&P 500 is holding up better than the broader market, but strong markets tend not to hang around technical “resistance.” The S&P 500 has been around 4,700-4,800 for 5 weeks. That’s “hanging around” to me.
Why? Because I can’t find a single equity ETF chart that looks like more like a ladle than a candy cane, if you know what I mean. Candy canes roll over at the top, while ladles have a long stem pointing downward, leading to a spot where what you scoop into it can sit.
Sorry, I’m not a cook and I don’t like peppermint, but hopefully you get the point. Candy canes everywhere, except for inverse ETFs, where I see some emerging ladles. Happy to accept suggestions on better analogies for these basic chart patterns!
ETFYourself.com is new, but the investment process behind it has evolved over the past 3 decades. You bring the desire, we'll provide the tools!
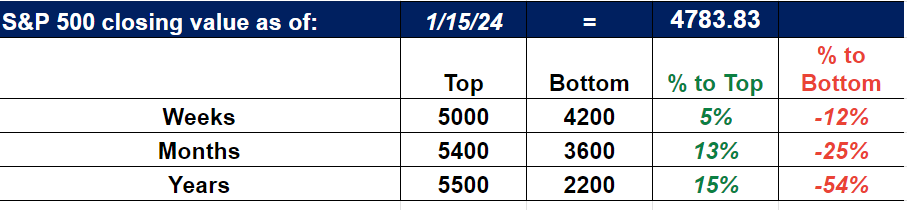
S&P X-Ray

The S&P X-Ray tracks our latest projected trading ranges
for the S&P 500
(Updated weekly on Tuesday, as of Monday’s market close)