January 23, 2024
The latest research, market indicators and trade summaries from Sungarden Investment Publishing
ROAR Score

(Return Opportunity and Risk)
If my choices are stocks and cash, what % would I have in the stock market right now?

Market in a Minute

Tech meltup coming?
I remember the year 2000 like it was last year. I managed “other people's money” through the entire Dot-Com Bubble, which burst that year. That ended a rarely interrupted stretch of 6 years of investor bliss. There were occasional selloffs during that period, including a 19% drop during 1999. But the market quickly recovered.
But to say “market” is to imply that anything investors bought went up. That was not the case. The tech sector, and this exciting index which had been around since 1971, but was really a stock exchange for early-stage companies, entered the public’s consciousness in a big way. That was the Nasdaq. And after a 79% rally in a newly-created ETF that tracked the 100 largest stocks on that stock exchange during 1999, it was thought of by many as a “can’t miss” investment.
That continued into 2000, as this chart shows. QQQ rose by 26% during the year’s first 9 weeks, a pace even faster than that of 1999. But a strange thing was happening under the surface. The SPY FELL by 4% at the same time. The Dow (DIA)? Even worse, down 13%. And the Utilities sector, normally considered the “escape route” for stock investors historically, dropped 9%. All of this in just 9 weeks.
QQQ had conducted a not-so-hostile takeover of the US stock market! There was seemingly no end in sight. Wall Street was universally bullish on this new internet/tech-driven era.

And then, this happened. After 9 weeks of QQQ bliss, 43 weeks of QQQ mess. It lost nearly half its value, and ended 2000 off 36%, despite that strong start. 2001 and 2002 were similar. QQQ fell by more than 30% 3 years in a row. It was like a years-long detox for investors drunk on overvalued “popular” stocks from the tech industry.
And, since SPY had become so overweighted with those big QQQ-holdings, it, too, suffered, though not nearly as badly, finishing -9% for 2000. That was followed by declines of 13% and 22% in 2001 and 2002, and a rough start to 2003, just for good measure. At the low point, SPY had lost about half of its value from the 2000 all-time high.

But there were places to hide, at least in 2000. DIA held in well, and the Utilities sector flew higher the rest of the year, as interest rates fell by 1.5% (from 6.5% to 5.0% on the 10-year US Treasury). Not because the economy was getting better. Because it was getting worse, quickly. All of the things that were market risks for years finally came home to roost.

Why am I bothering you with this ancient history?
Because we are currently living through the most similar period to the one recounted above that I have seen. The world and markets are very different, of course. But if I’ve learned anything in 38 years in the investing industry, it is this: at the core, human behavior doesn’t change. Greed still goes too far, and risk-management is an annoying afterthought many investors don’t want to be bothered with.
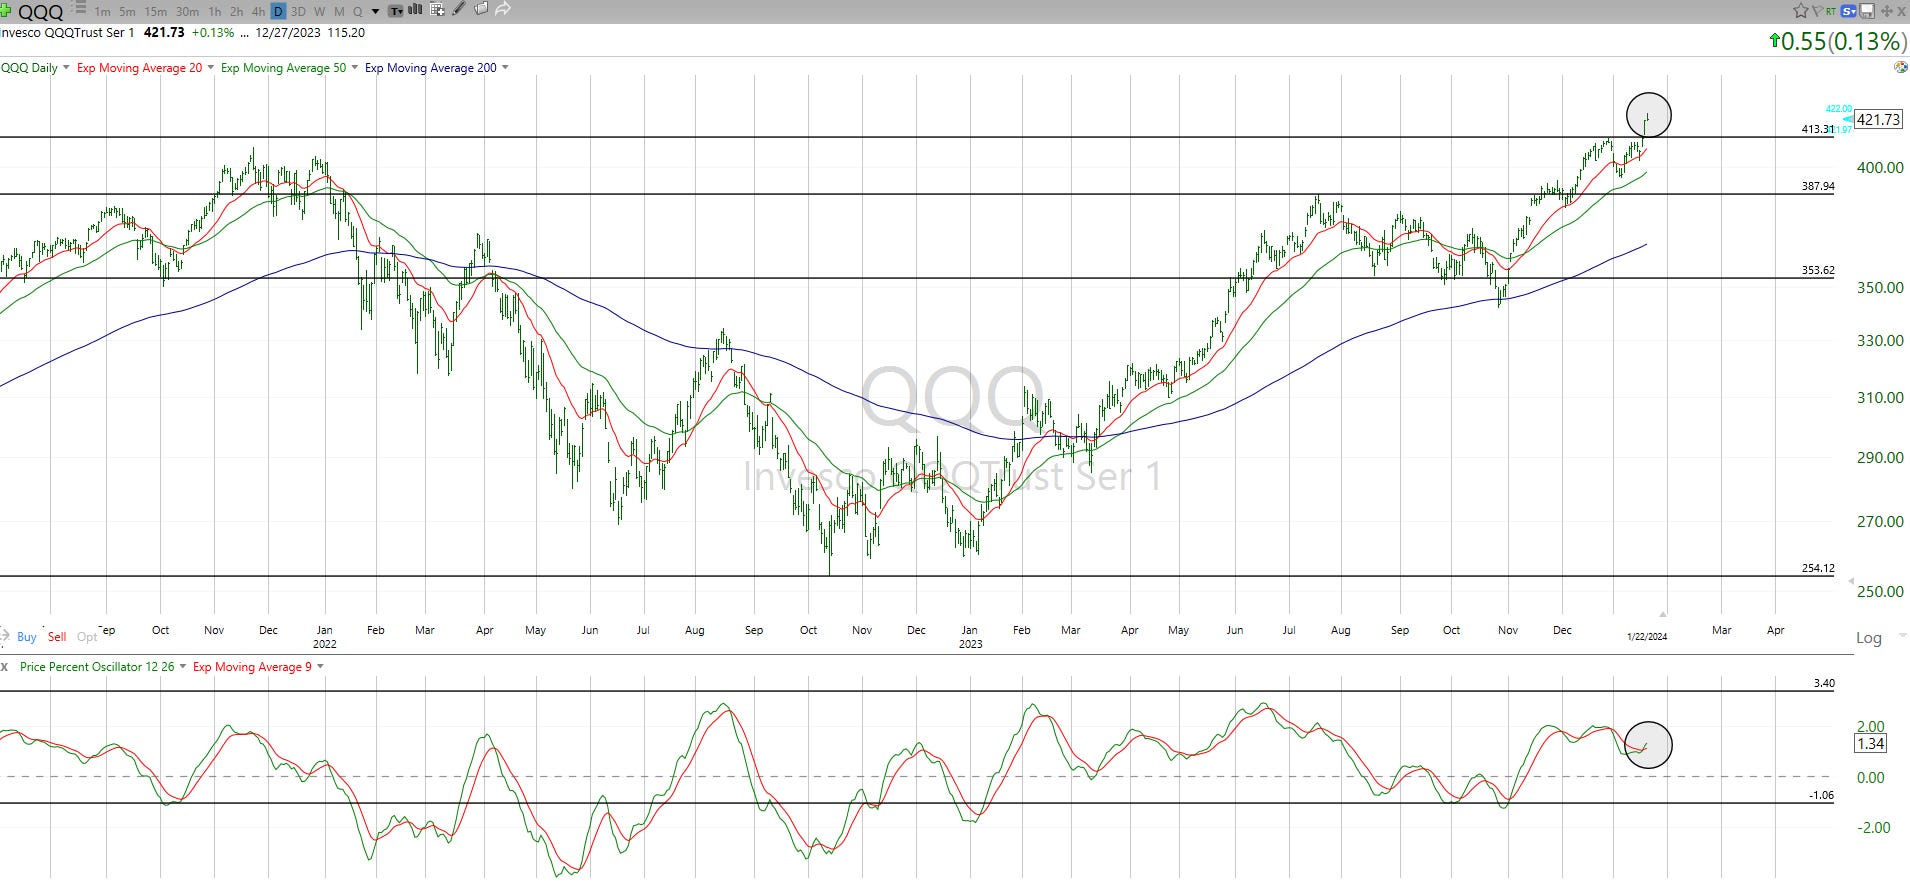
Here’s the current QQQ chart. It just broke out to a new high. I don’t know what will happen next, but it looks like it could have “legs.” Most of the market does not look like this, as premium subscribers have seen me detail in the new Thursday Depth Charts.
We’ll be talking technical analysis…without the usual complex lingo…at
TONIGHT’S CHARTY PARTY LIVE EVENT
Tuesday, January 23, 2024, 5pm ET
Link to sign up is here
The plan:
Our ROAR Score stays at 20. Our 2-ETF model portfolio remains allocated 20% in SPY (S&P 500) and 80% in BIL (1-3 month T-bills).
However, if this potential melt-up scenario “gets real” then we’ll look to raise it soon. Our tactical approach to investing is about being prepared for both types of “tail risk”: the drops AND the pops!
ETFYourself.com is new, but the investment process behind it has evolved over the past 3 decades. You bring the desire, we'll provide the tools!
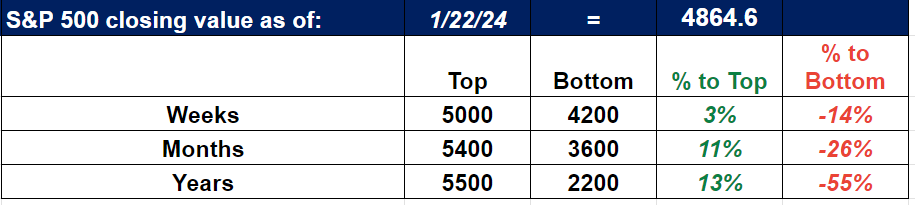
S&P X-Ray

The S&P X-Ray tracks our latest projected trading ranges
for the S&P 500
(Updated weekly on Tuesday, as of Monday’s market close)