Silver Lining Playbook?
The SLV ETF is a good example of a "classic" chart pattern. But charts don't always work the way they used to.

So, here’s one of the biggest reasons we started ETF.com. In addition to the broader, big-picture investing experience and knowledge I aim to transfer to our subscribers, there are things like the chart of SLV (Silver - the metal, not the stocks, though the ETF ticker for one of the Silver stock ETFs is ‘SIL” fyi btw pdq…:-).
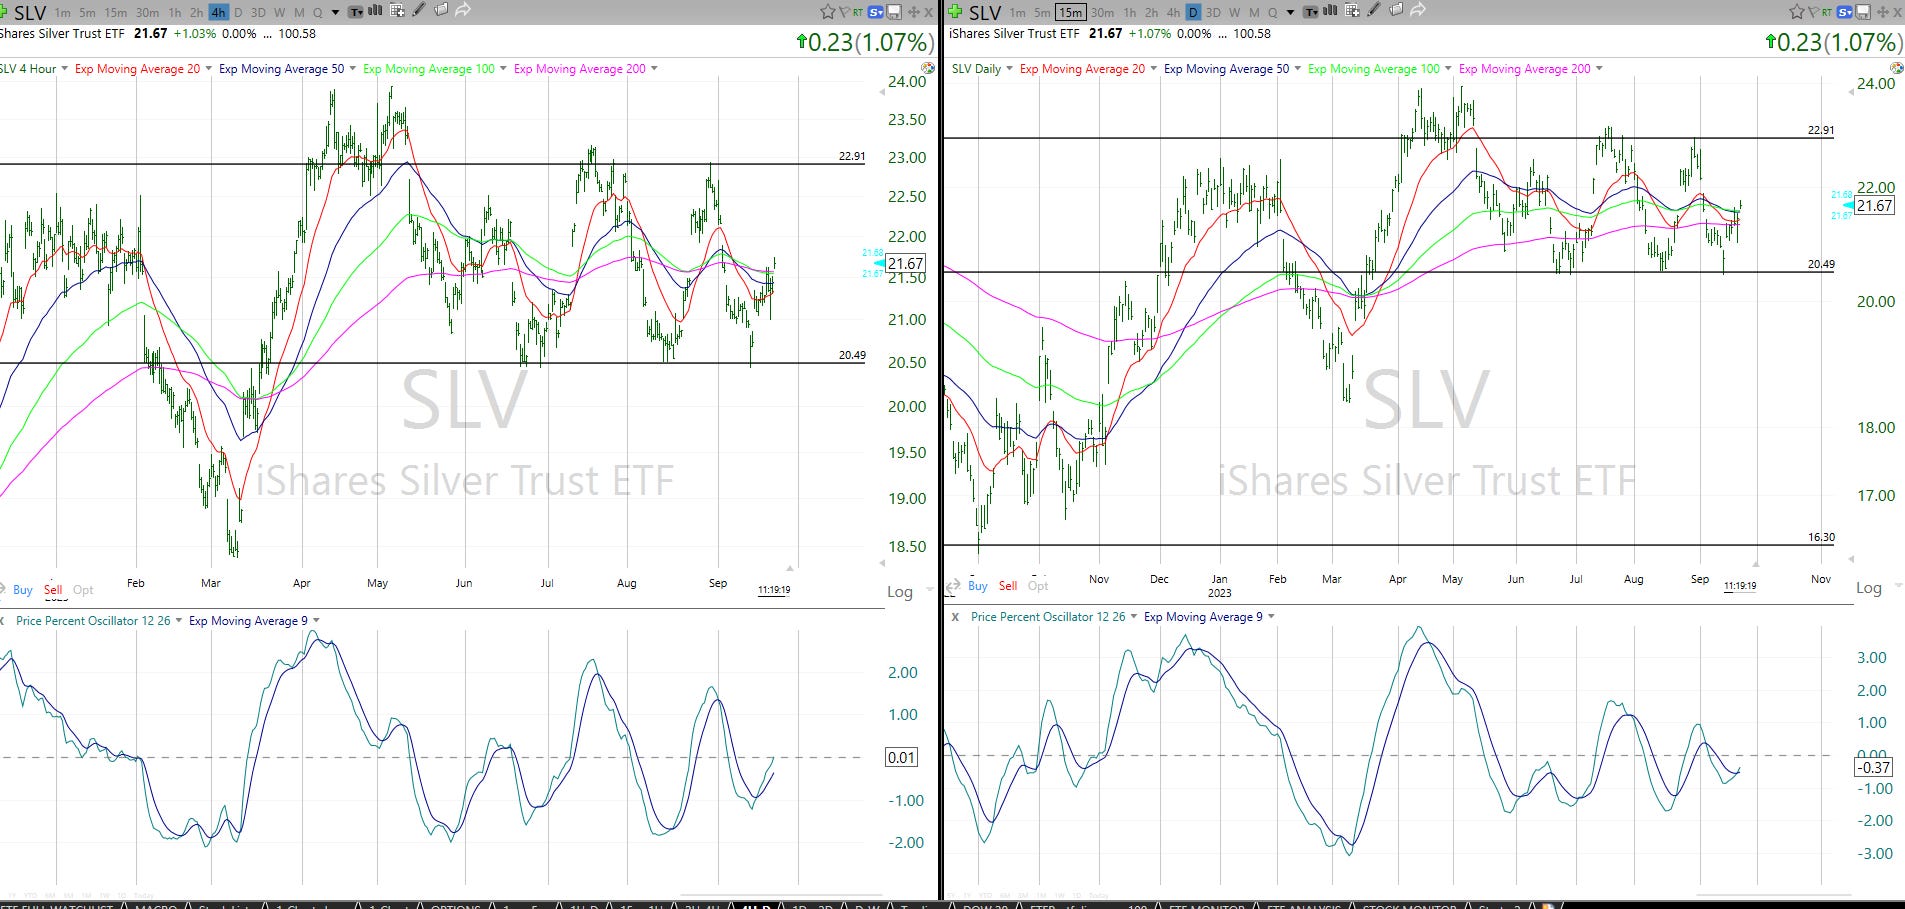
SLV’s current chart is a “classic” pattern to me. See below, with the 4-hour chart on the left (each vertical line is the high-low-close price for a 4-hour period) and the daily chart is on the right. SLV has been trading in a range for most of this year since late March (when the S&P 500 started its big move for this year). SLV has obeyed those upper and lower lines I drew, which we call “resistance” and “support” respectively.
When I started charting at age 16 back in 1980 (my late Dad taught me with pencil and graph paper, and a big packet of charts from a company whose name I forgot, that would come in the mail every Saturday. That and reading the baseball stats on Sundays were weekend highlights. I know, what a geek. But I digress.
Back to SLV: it is moving up from the $20.50 lower end of the trading range and that would make me look at $23.00 (top of range its been in) as a target. That’s $1.33 upside to that target, or about 6% gain if it gets there. That brings to mind 2 points about how modern markets work, versus how they used to work:
Until maybe 3-5 years ago, technicians were lonely. Now “everyone” is a chartist. And that brings a lot of very thin, incomplete analysis to the masses, as well as a lot of snake oil salespeople. I’ve seen it up close. But its so crowded with chartists now, many formerly-reliable approaches to charting don’t work as well as they used to. Frankly, I think that gives an edge to those that have been around long enough to even recognize that evolution. So, while SLV could easily run up to $23 and beyond, the habit of many market segments in the current climate is to start the move (like this one did), and then "run out of gas” before I’d expect it to.
This is a rare market segment that actually looks like it has a chance to rally here. And while I’m not planning to spend too much time talking about short-term trading in ETF Yourself, I do want to tell folks what I see, when I see it. So SLV does have short-term potential, and I did buy a tiny “out of the money” call option position, as much out of curiousity (since I thought enough of the chart to write about it). This is one of many examples of what I call “taking big shots with small amounts of money,” which I’ll provide many examples of, using ETFs, to subscribers goin forward.
Remember, investment management = risk management. That’s why my #1 investing rule is “Avoid Big Loss.” Because in modern markets, we can learn a disciplined process, look back at what worked, and think we know what’s going to happen. But there are a lot more hurdles to that “classic” thinking than there used to be.
And that’s why we started ETF Yourself. Enjoy!