

The S&P 500 that wasn't
Our weekly ETF charting education focus


SAVE THE DATE: our first AMA “CHARTY PARTY!”
Given the tremendous interest in the charting part of what we do at ETFYourself.com, our next “Ask Me Anything” session will be 100% devoted to charting, learning and communicating what some call my investing “secret sauce.” I just hope the session doesn’t affect your body’s system like a Big Mac.
We’ll affectionately refer to this as the AMA “CHARTY PARTY.” Feel free to bring the beverage of your choice to this live video event.
Tuesday, January 23, 2024, 5pm ET. Link to sign up is here
This stock market looks more and more like one of those old playground movies, like “Sandlot” or even “The Little Rascals.” OK, you bring your best and I’ll bring mine, and we’ll see who wins. When it comes to the S&P 500, the best are in very short supply.
I’ve seen a lot in 38 years of market tracking, and I just don’t think I’ve seen anything quite like this
Below is a snapshot to try to communicate the story I see the market trying to tell us. Remember, that’s my mantra: the markets always tell us a story, we just need to listen. So let’s do that thing they say about using our 2 ears and 1 mouth in that ratio, and listen in on what the S&P 500 has been telling us for at least 12 months now.
Because unless something changes quickly (like a burst through to new all-time highs that doesn’t quickly fade), we have a very concerning market at the “headline” level. The good news: the approach to assessing and acting here is not about what “the market” is doing, since the 100 ETFs we track are so diverse, we can make money in any climate. Even one as historically messy as this one. Here’s what I’m looking at:
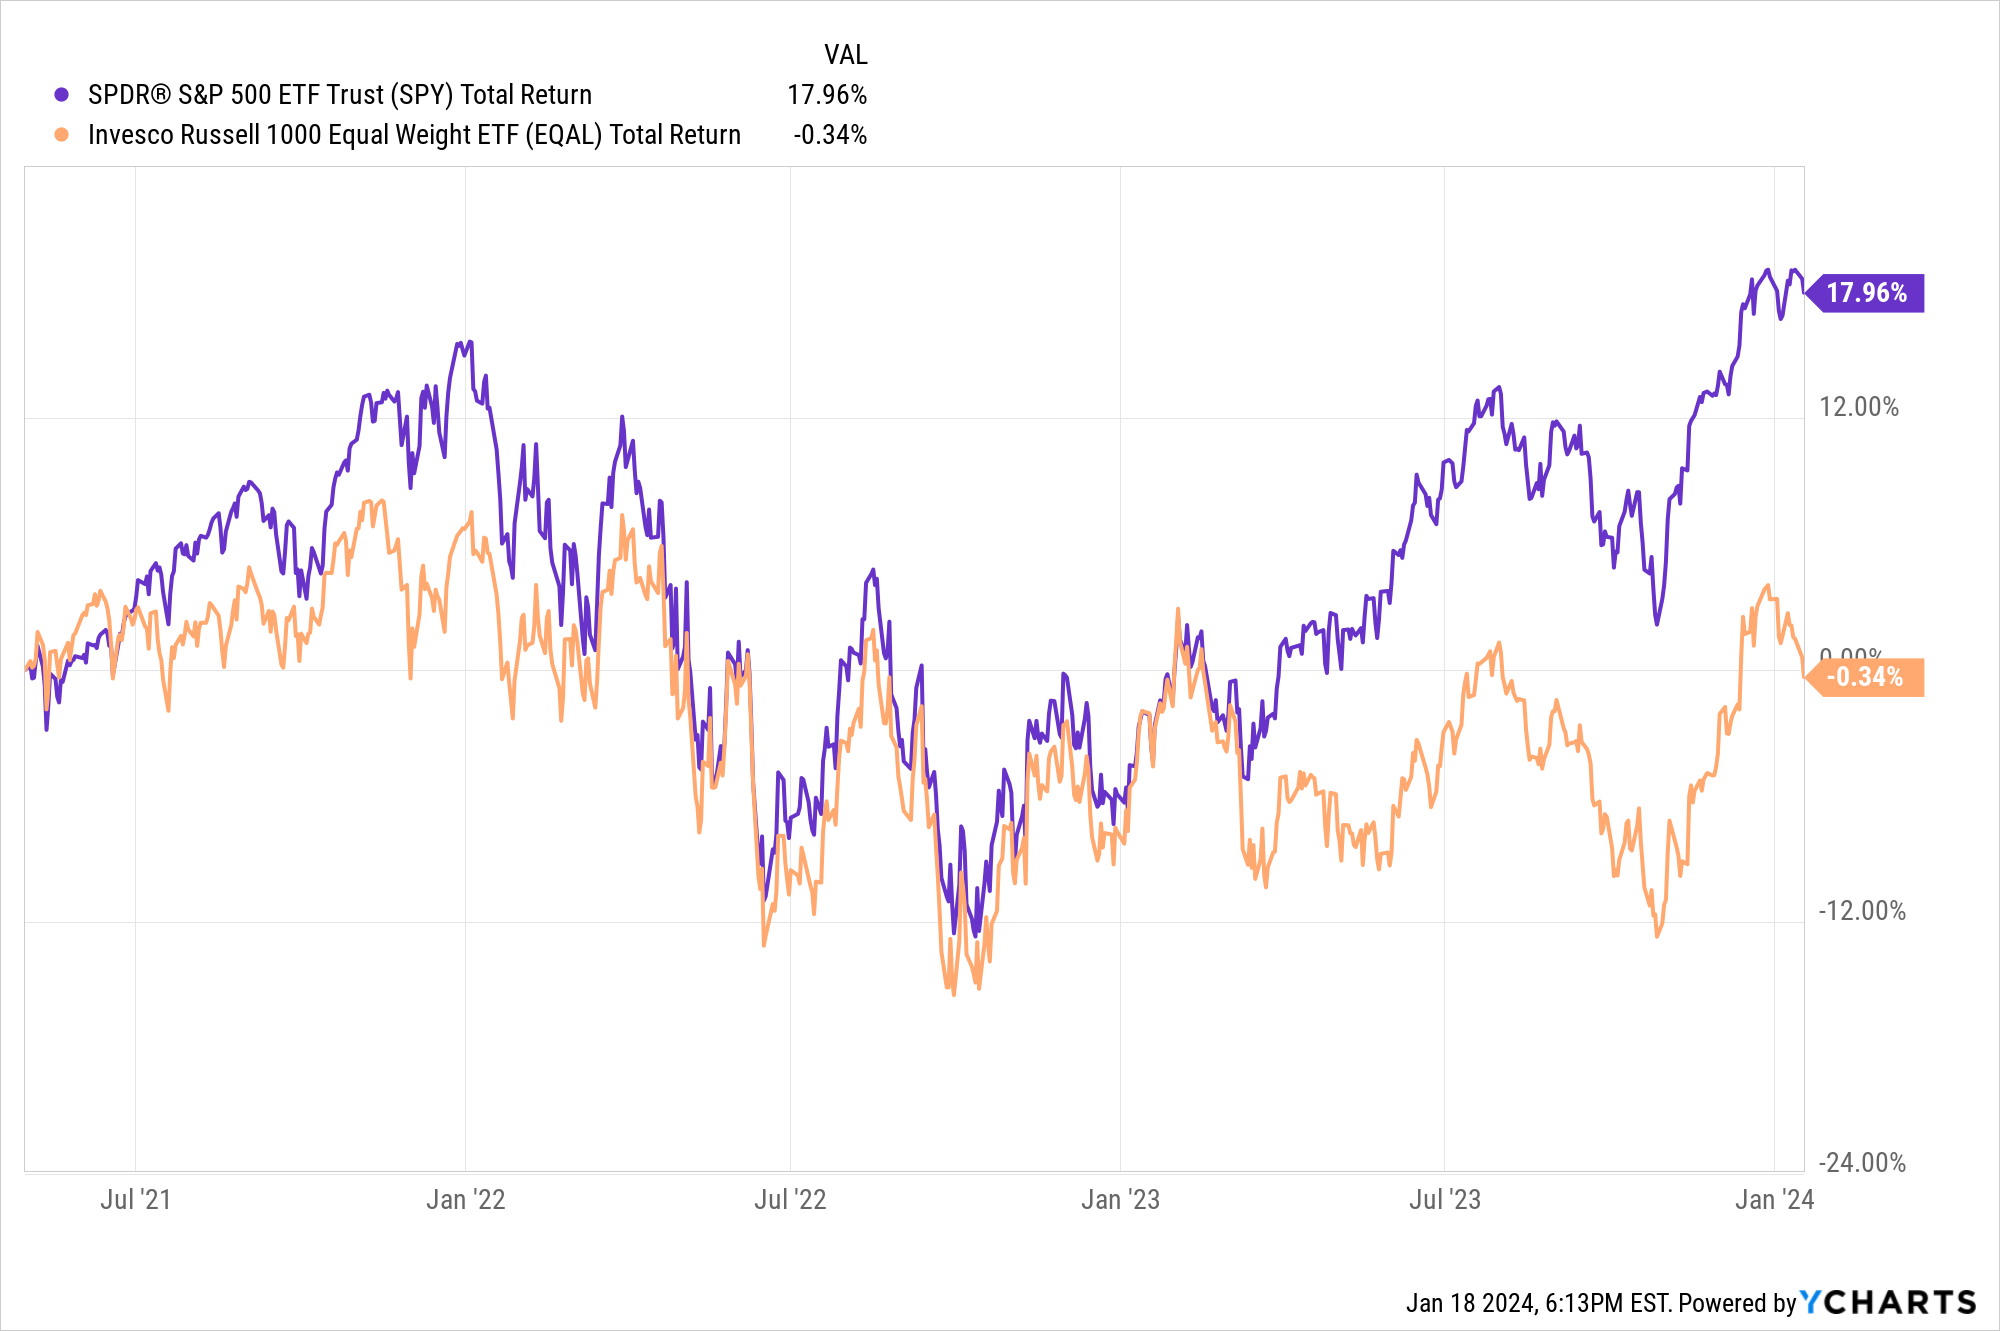
Since April 30, 2021, just as we were starting to realize the pandemic would not be here forever, SPY is up a total of 18%. The average of the 1,000 largest stocks (EQAL) is up, no wait, DOWN a fraction of a %. This includes dividends, and in case I didn’t mention it, this is going on 3 years of this!
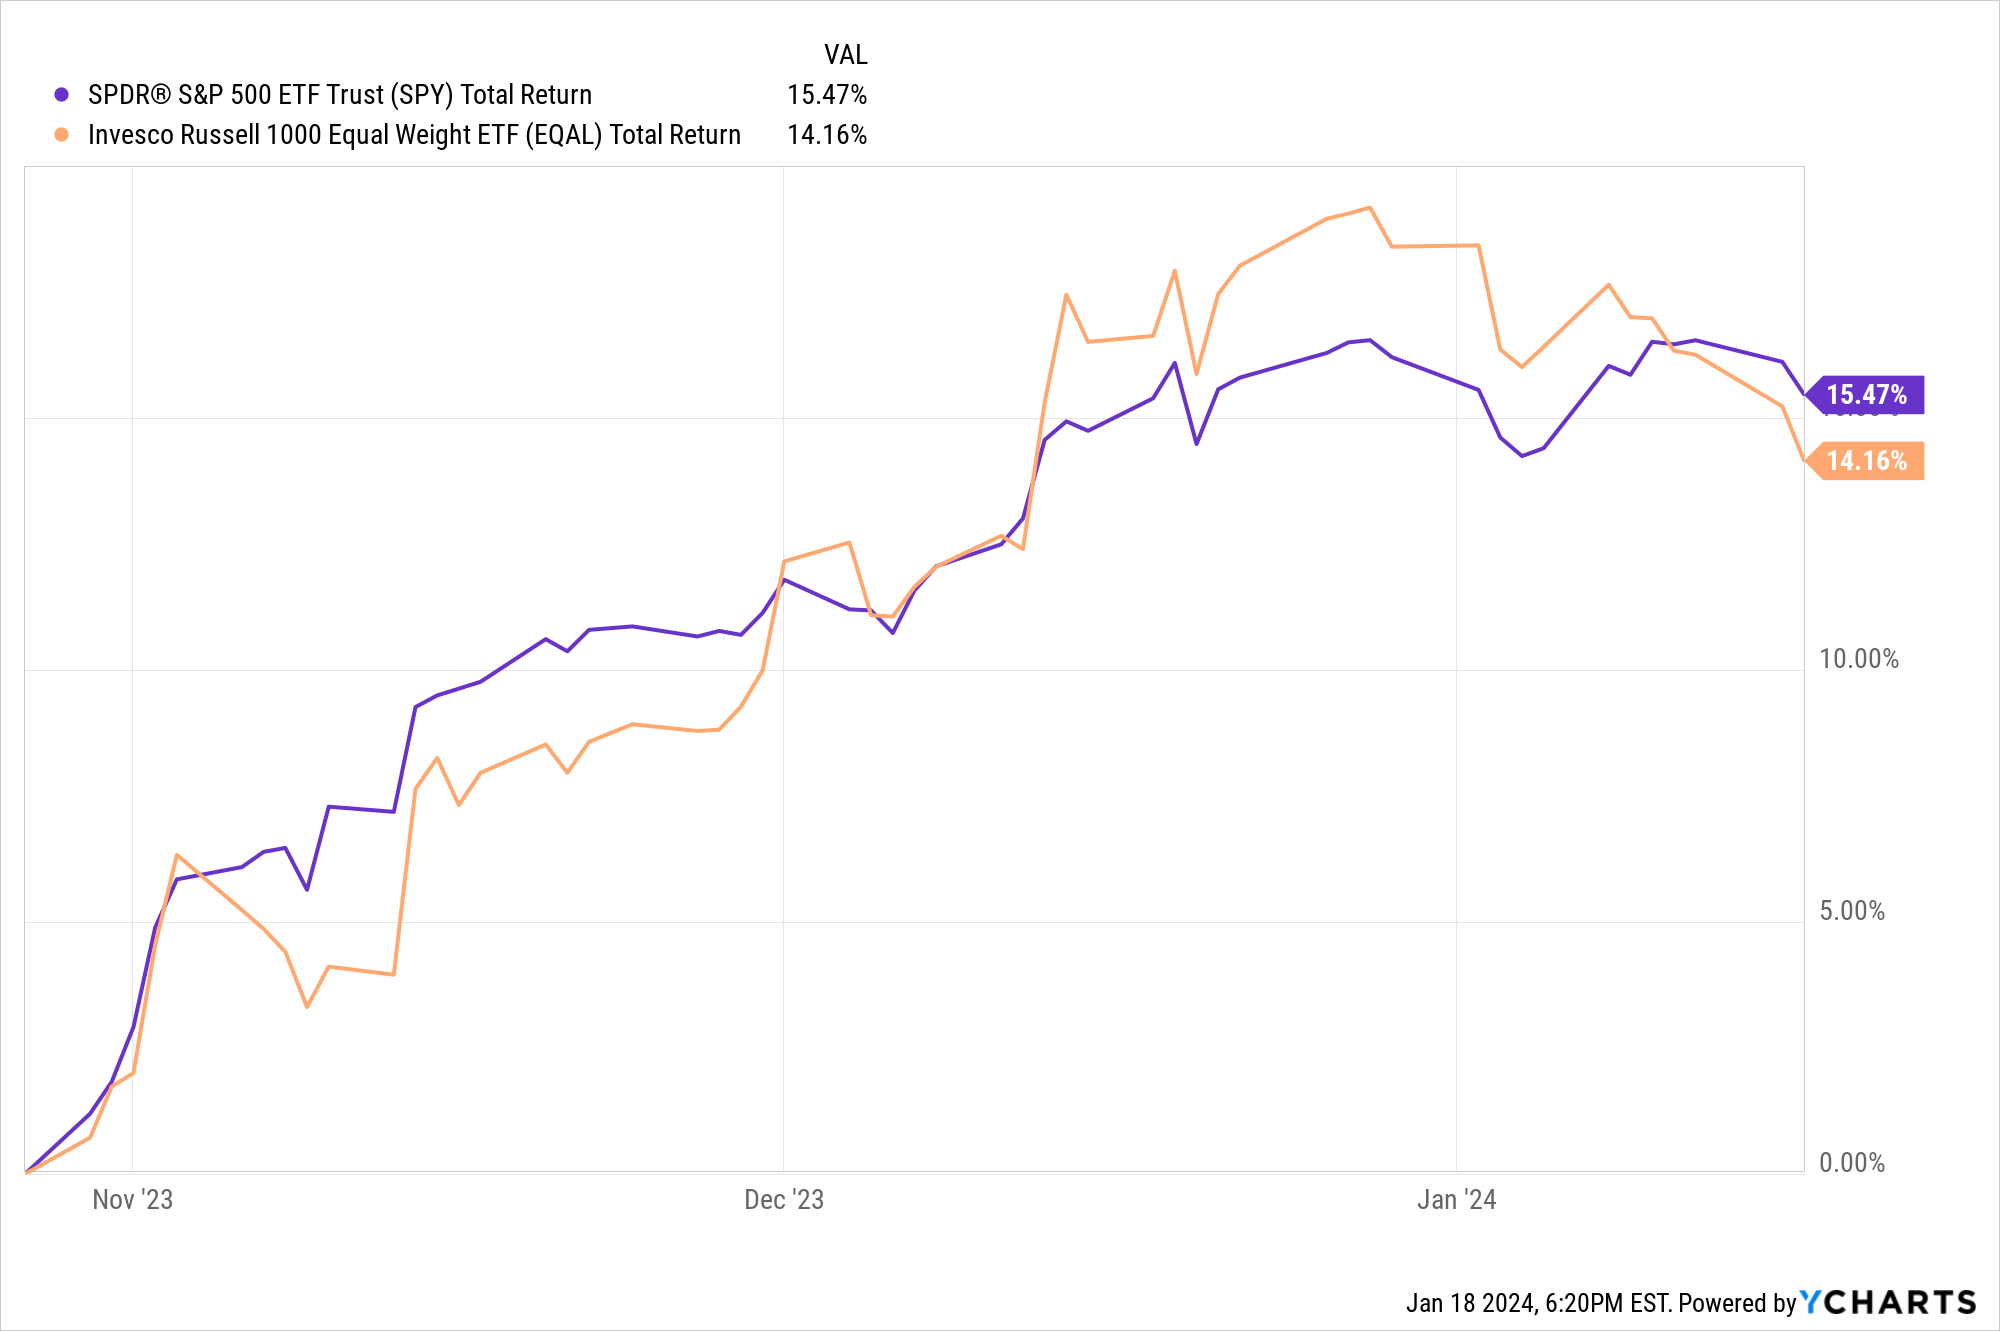
Ah, but here’s the “recency effect” attached to this. Since last October 27, just 3 months ago, we’ve seen this: “everything” rallying, making many forget all that occurred before then. I went through this as an investment advisor to clients for 27 years, and this is where it’s tempting for some to say, “why aren’t we keeping up with the market?” Well if you are flat for 3 years, you are! But psychologically, we tend to remember the wins and suppress the losses.
Why am I droning on about this? Because investors still habitually want to buy every dip. It works, right? Wrong. If the average stock is flat for nearly 3 years, the buy the dip stuff is a temporary sugar high that folks have convinced themselves is still more than that.
To me, this is what we need to “clear” the stock market, and the charts scream this to me every day: we need a cleanout. Am I rooting for one? Heck no, because rooting for things in the markets detracts from real analysis time, and we only have so much time in a day.
The S&P 500 and Nasdaq are the clear “generals” here, and they are both stuck trying to break to new highs. It has been a month of spinning wheels. Meanwhile the thing that drove the rally last last year, falling interest rates, is well on the way to reversing. 7 of the 11 S&P sectors have started the year in the red.
A lot of “evidence” about whether we’ll see the plot of this story develop will arrive soon. This simply means that clear signals are hard to come by, as reflected in the depth charts. The free one is updated below, but it is not moving around much.
Today we launch our premium subscriber depth charts. They will be posted shortly to the shared research deck you were given access to when you signed up, in a new tab called “DEPTH CHART (premium).” Because we’re so dang original around here :-)
The ETFYourself.com Depth Chart (free version)
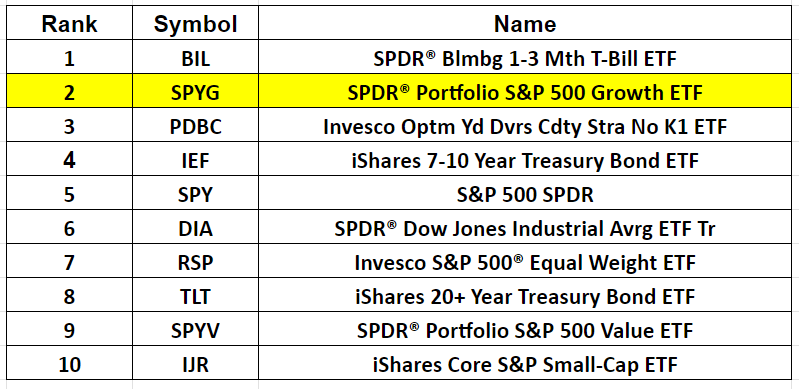
This free weekly edition has a table ranking the relative attractiveness of 10 major market indicators, represented by ETFs that track them.
A funny thing happened. Not “funny-haha” but “funny-that’s something I really didn’t expect.” Each week I’ll highlight in yellow the most notable of the 10 macro ETFs we list here. Last week, I wrote, versus last week, growth stocks look a bit better relative to value stocks, so that lifts SPYG to the #4 in this relative ranking.
This week it is up to #2 and other than a too-early potential move to come in the commodities (PDBC) segment, large cap growth stocks are trending up a bit. So SPYG moves to #2, but all are well under #1 BIL unless/until we get a bigger sign of momentum. Why QQQ looks stagnant and SPYG looks decent, even while value stocks continue to lag is something I need to dig deeper on. And I will.